Review attendance patterns and open the next action
Written for: Attendance staff, pastoral leaders and school leaders with the relevant access.
Set the attendance period and method, explore group patterns and open a filtered pupil review or next action.
Read the period, methodology and coverage alongside every percentage. A pattern is a prompt for professional review; it does not explain a child’s circumstances.
Before you begin
Section titled “Before you begin”Open Attendance → Analytics. You need access to this workspace and to the pupils and dimensions you intend to review. Ask your school administrator if the item is missing. The school needs attendance records and relevant pupil information; some panels also need session breakdowns, an attendance target or published benchmark data. Governors have a school-level view and do not see the named Signed out section. Statutory information depends on access and jurisdiction.
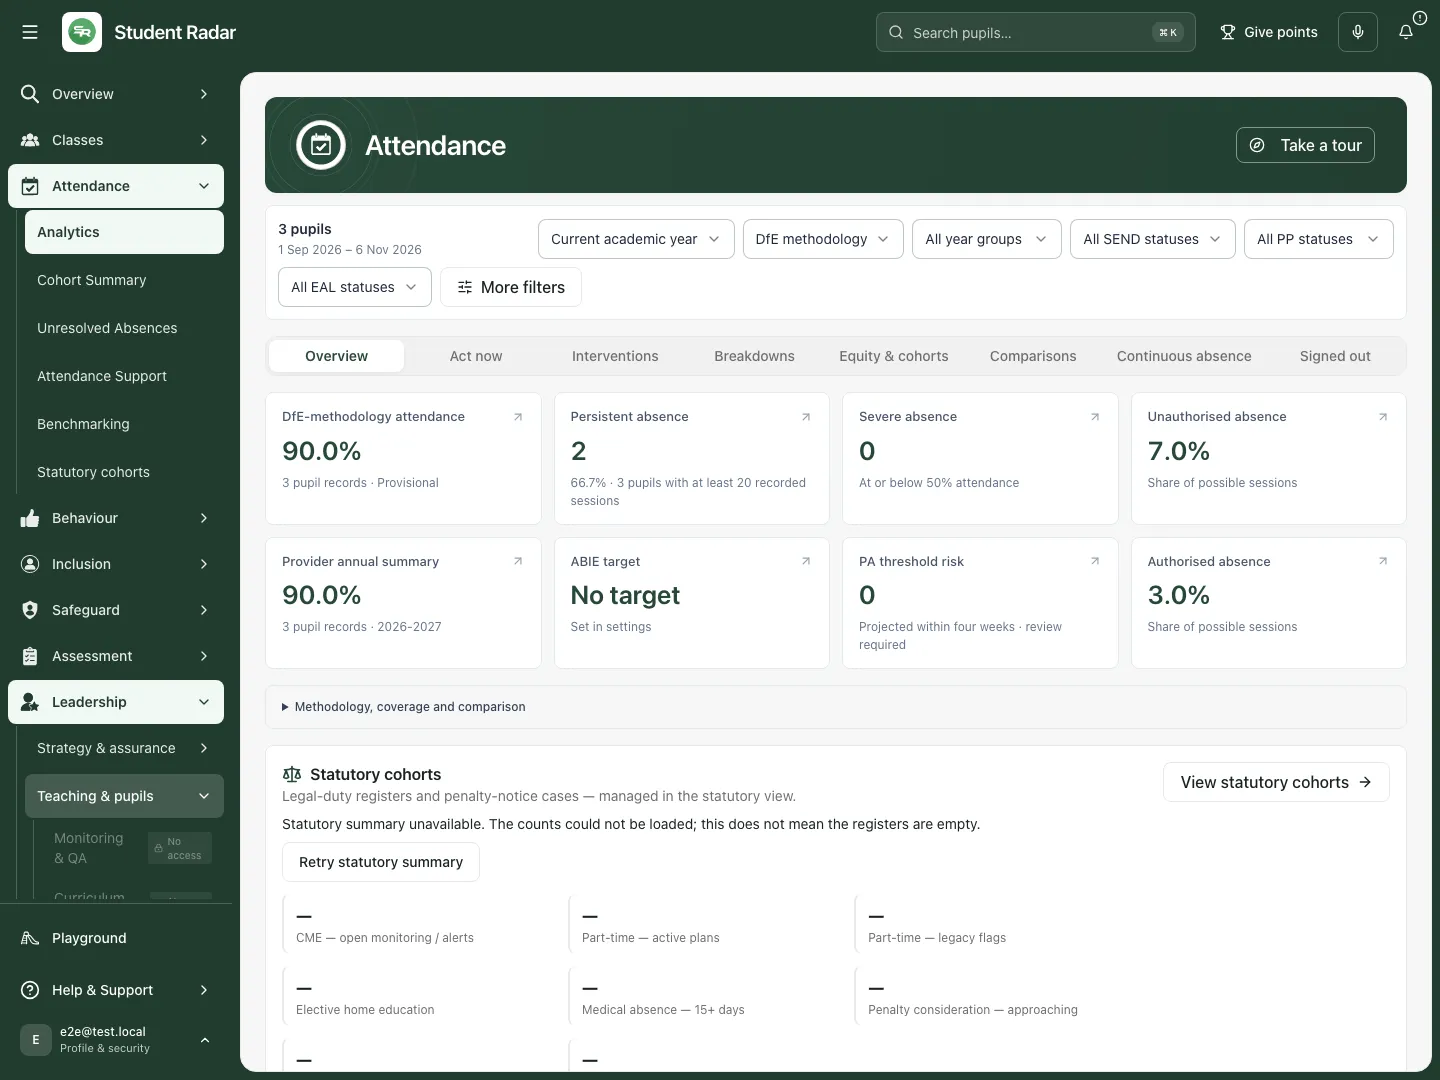
The headline has 270 present-like sessions out of 300 possible sessions in this fictional example. Its Provisional label means it is a recorded working figure; do not use it as a certified figure or a published statutory comparison. Some other sources may still be unavailable.
Set the question and the period
Section titled “Set the question and the period”- Check the pupil count and dates at the top. Clear any unwanted dashboard filters; figures explicitly marked whole school can have a different scope.
- Open Attendance date range. Choose Current academic year, Last 30 days, an available term, or Custom dates…. Term choices depend on the school calendar.
- Choose Attendance methodology: DfE methodology, All recorded sessions, Compulsory-age window or Age-weighted window. Keep this choice consistent when comparing figures. These windows can have different eligible pupils and sessions.
- Choose Attendance year group and any available characteristic filters. Open the additional settings for more detailed choices, dates, comparison period and targets.
- Read the current selection again before discussing or exporting a result. Use the reset/clear controls to remove filters rather than assuming a fresh section starts from the whole school.
Choose custom dates and detailed settings
Section titled “Choose custom dates and detailed settings”- Select Attendance date range → Custom dates…, or select More filters to open Attendance Settings.
- In Analysis scope, choose Custom Range, then use the Attendance start date and Attendance end date date controls. Choose an end on or after the start.
- Check the pupil methodology and the Enrollment Status selection. Use Limit by group for Year Groups, Class and Report Groups; use Pupil characteristics for available characteristics.
- In Comparison and thresholds, choose Previous Term, Previous Year, Previous Cohort (same pupils) or Custom Period. For a custom comparison, choose both comparison dates. Read the same-pupil coverage warning if that option cannot be verified.
- The ABIE target section holds the school’s target details where you have permission. Check the target’s academic year and status before making a change; use the target’s save control and check its result. A chart setting is separate from a saved school target.
- Select Done to close the analysis settings. Recheck the displayed dates, pupil count and methodology. Reset restores the analysis defaults; do not use it as a substitute for deliberately choosing your review scope.
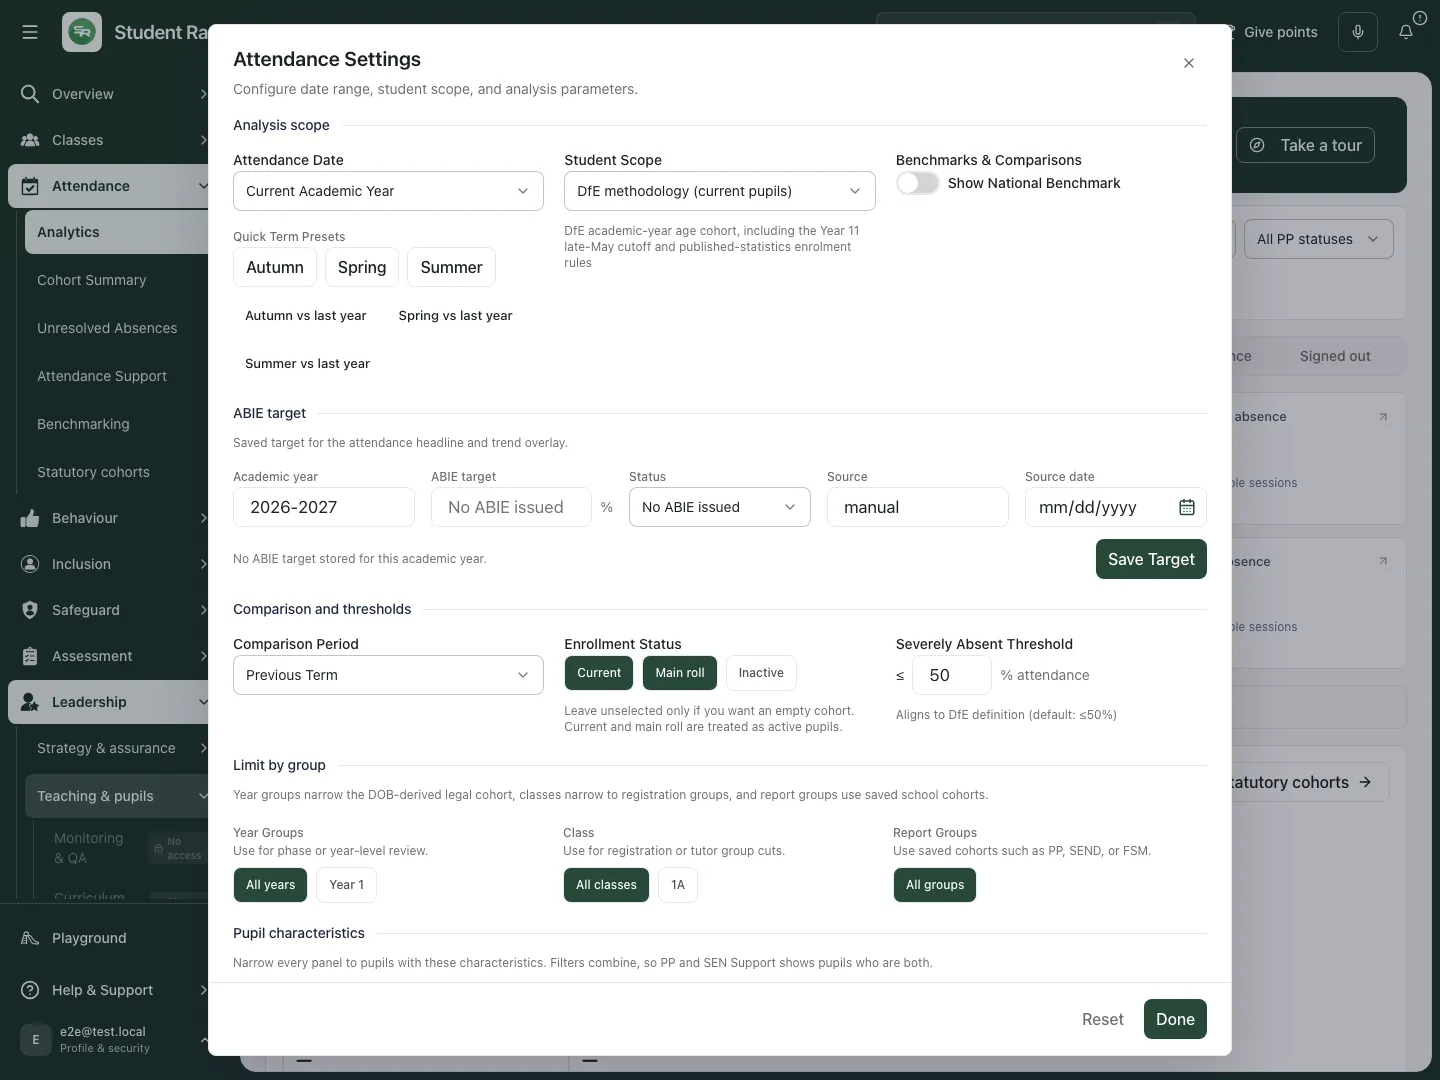
Choose dates and scope before interpreting a comparison. Some school target controls require extra permission.
Review Act now and open the next action
Section titled “Review Act now and open the next action”- Select Act now. Check Today’s absentees, Pupils near the PA threshold and Internal truancy — in school, skipping lessons.
- Read the date window for each list. The internal-truancy signal uses the last two weeks; it is a registration/lesson pattern to check, not a concluded explanation.
- Where a named pupil or list control is available, open it, check the session information and open the pupil context. If you export Today’s absentees using Export CSV, check the intended date and permitted pupils first.
- Review the difference between About to exit PA and Immediate PA risk. A zero means no matching signal in this selection; unavailable data needs a retry rather than a conclusion.
- Agree a human follow-up. For a support response, open Interventions or Open Attendance Support where offered and record an owned plan there.
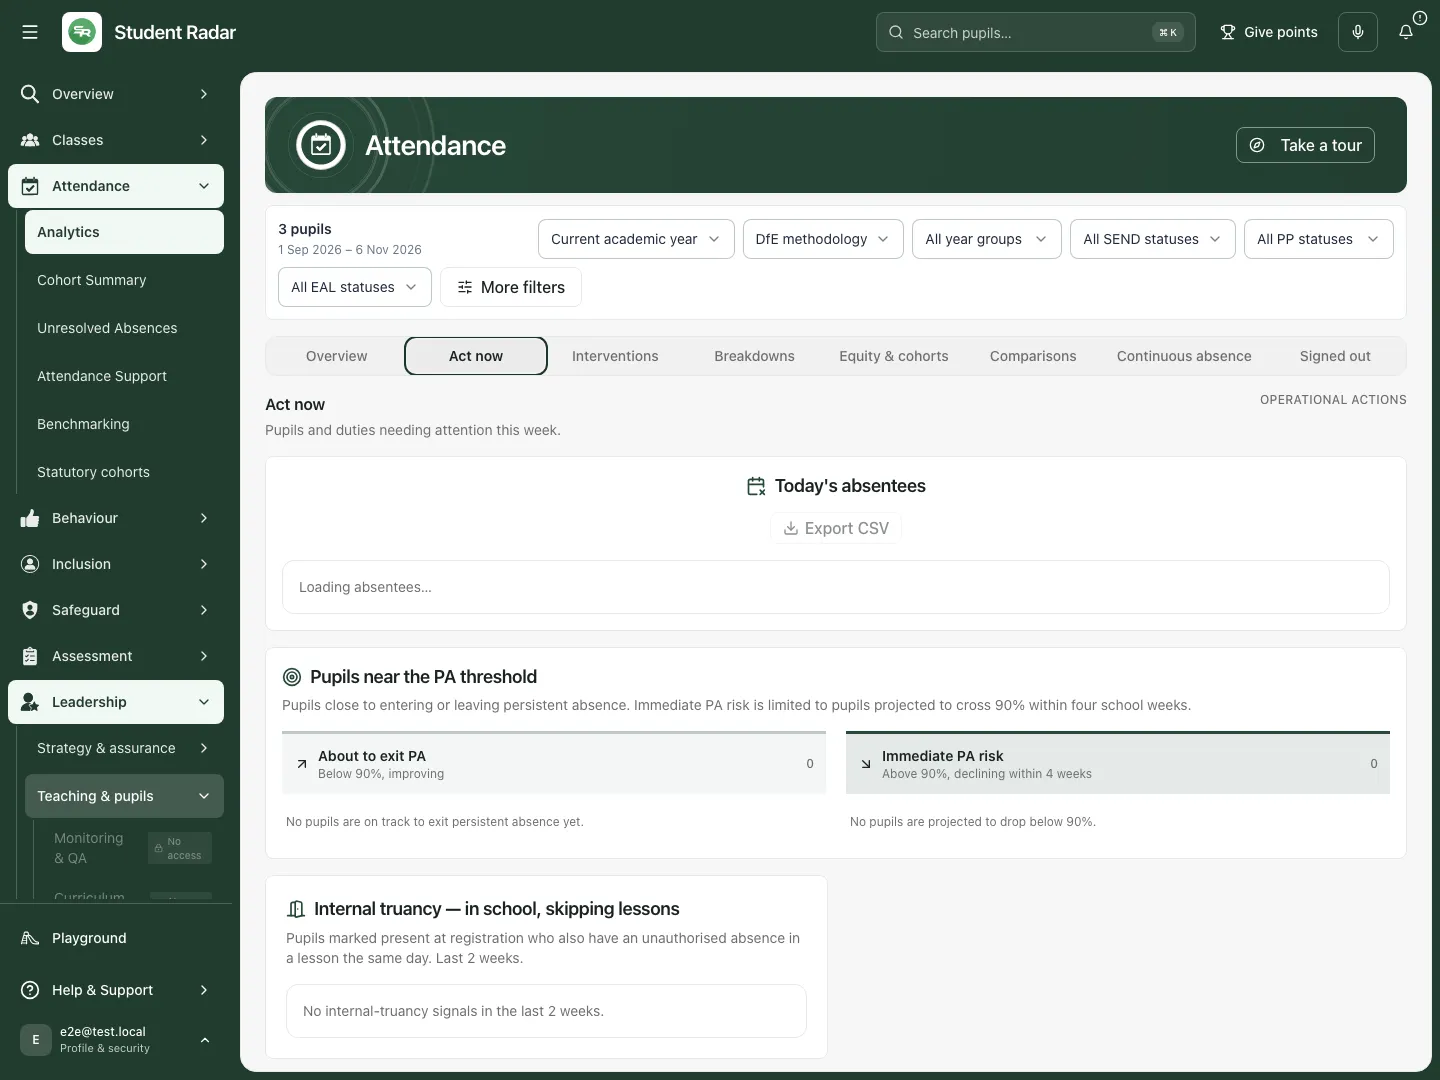
This fictional example has no pupils projected to cross the threshold; it does not demonstrate a legal decision.
Explore a breakdown without mixing types of lateness
Section titled “Explore a breakdown without mixing types of lateness”- Select Breakdowns and find Absence. Switch Reason for Absence to the day-of-week view when that answers your question. Use What do these codes mean? to read the code explanation.
- In Late to school, choose Late % or the average-minutes measure and choose the grouping, such as Year group or Day. These are AM/PM registration marks.
- Review Late to lessons separately. Choose the available grouping, such as Subject. Lesson marks answer a different question from registration marks.
- Read Attendance band distribution and Session Absence Heatmap with their period and count. Below-90% banding and risk headlines have different eligibility conditions; risk headlines require at least 20 possible sessions.
- If a chart has an expansion control, open it and use Export PNG or Export CSV from the expanded panel. Check the displayed scope before sharing. If breakdowns are unavailable, retain the notice and retry; do not interpret it as a clear pattern.
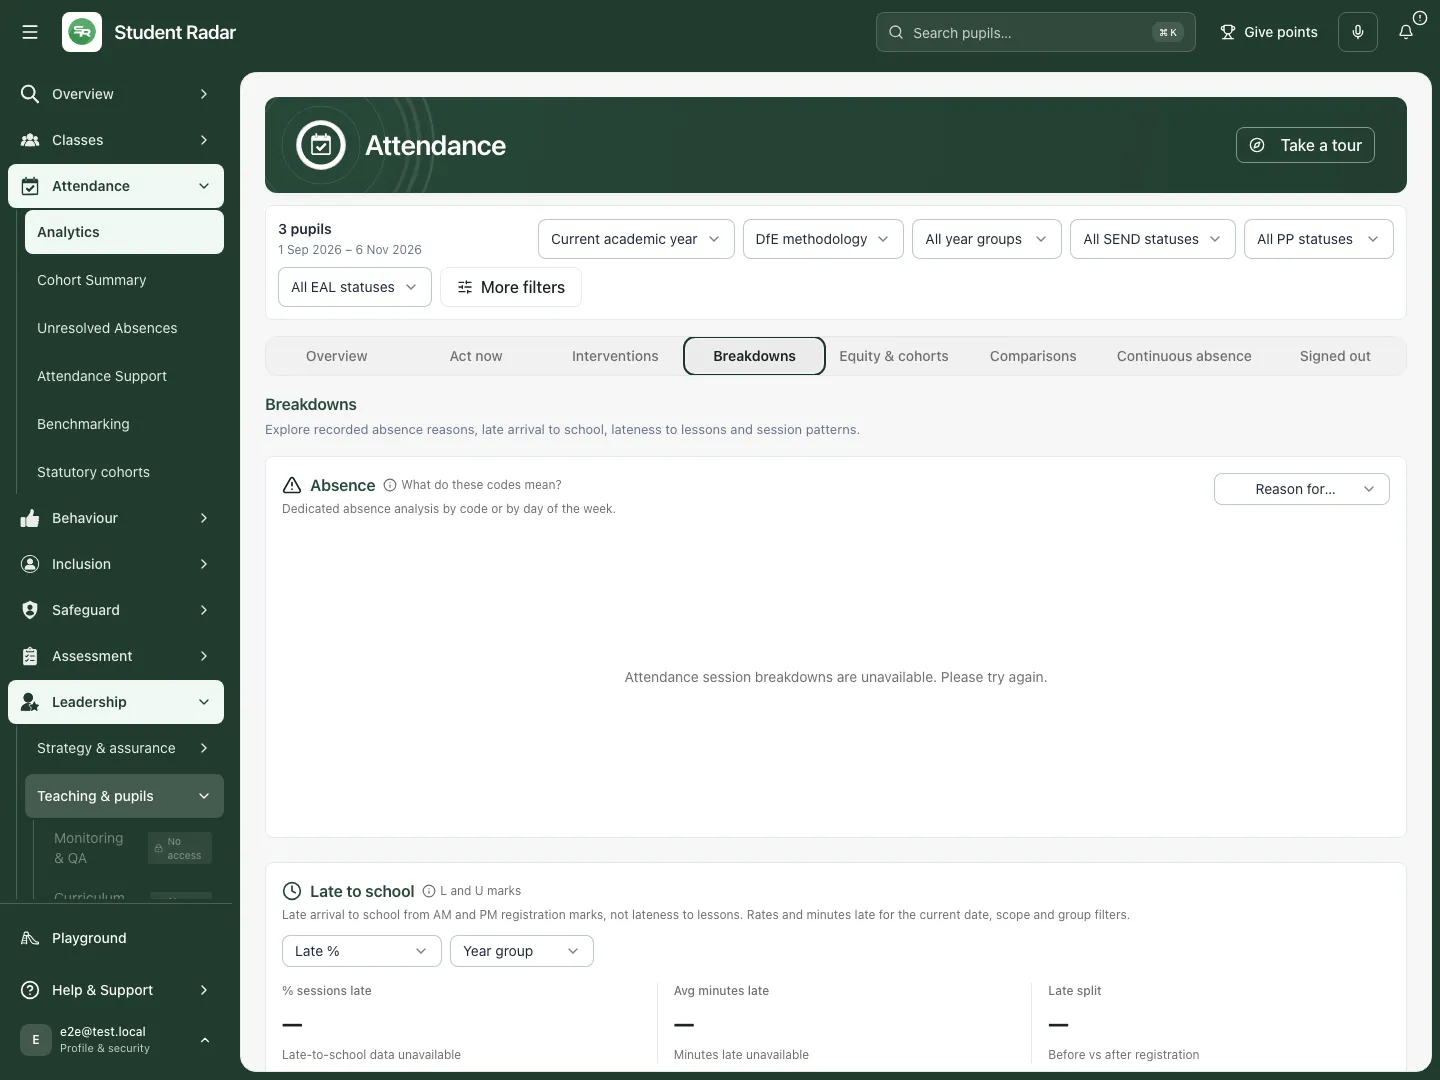
The band counts are available in this example while session-specific charts need more data. Registration and lesson lateness remain separate.
Compare groups and open a filtered review
Section titled “Compare groups and open a filtered review”- Select Equity & cohorts to review year-group and characteristic comparisons. Choose the attendance/absence measure offered for the relevant chart.
- Open an available chart/group selection to see the View group list dialog. Check the named group, its pupils, current scope and attendance coverage before selecting a pupil or using Export Selected.
- Select Comparisons for an explicit group-versus-other-pupils table. Read Attendance gap as percentage points, and read persistent/severe absence with the eligible-pupil counts.
- Use Filter to group beside the group you intend to review. Recheck the top filter chips and pupil count, then open the relevant analytical section. Clear the filter to return to the wider question.
- If a group or its comparison has fewer than five pupils, the table states Fewer than 5 pupils — not compared. Do not reconstruct the suppressed gap from other totals. Differences describe recorded attendance; they do not establish why a gap exists.
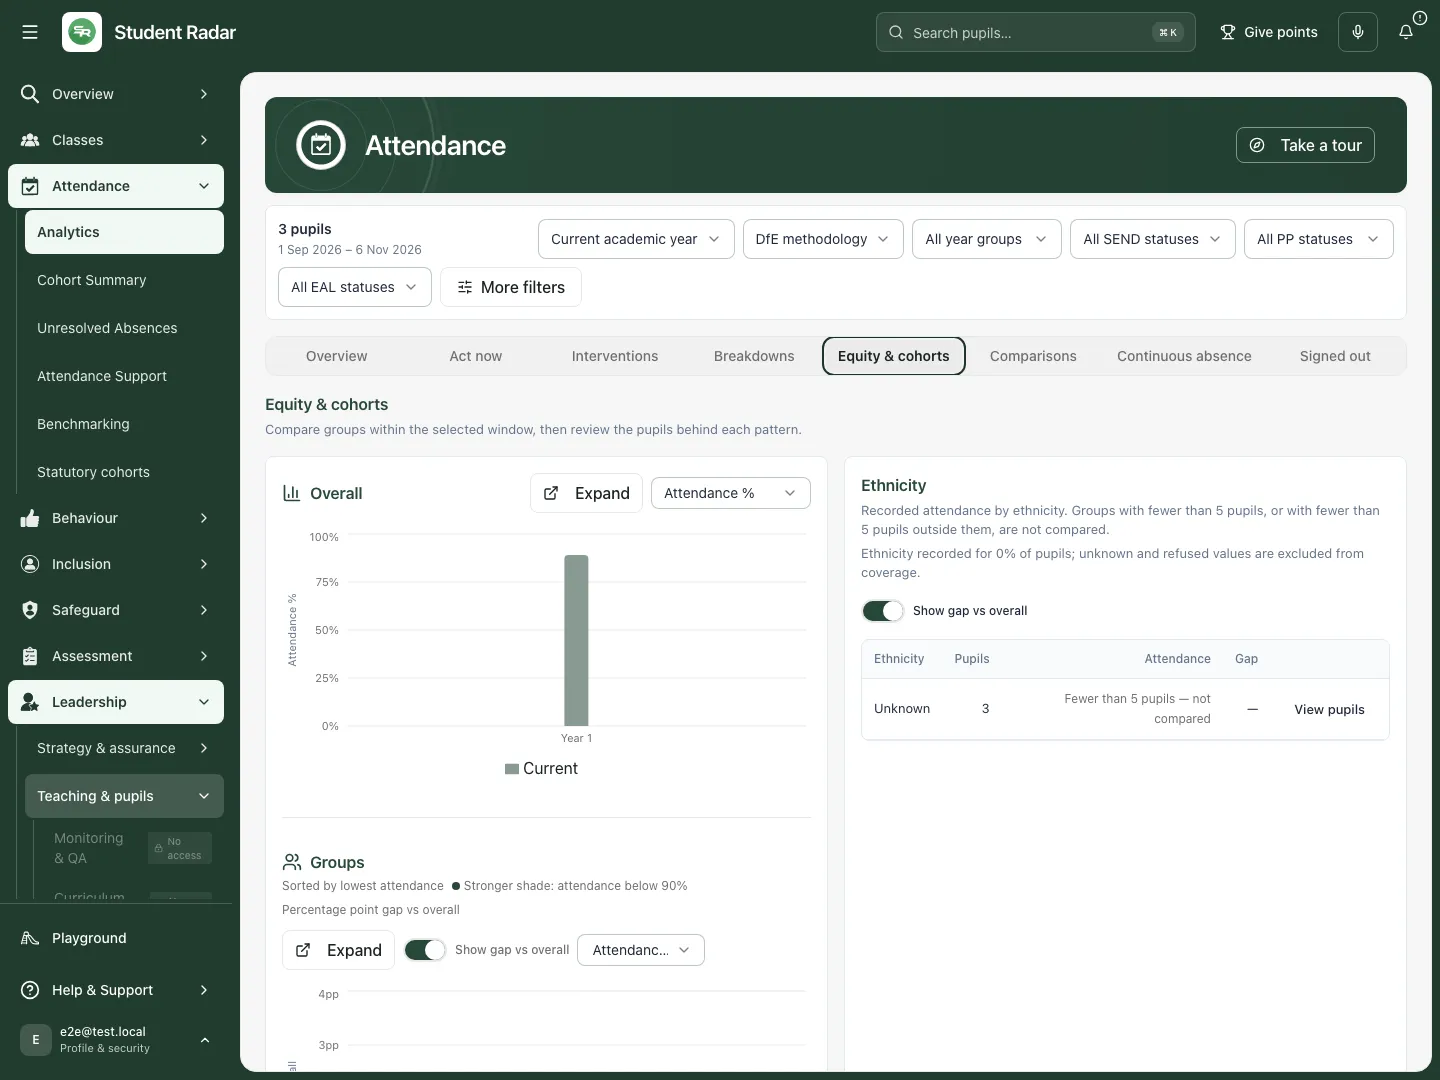
Read group eligibility and coverage before opening a pupil list.
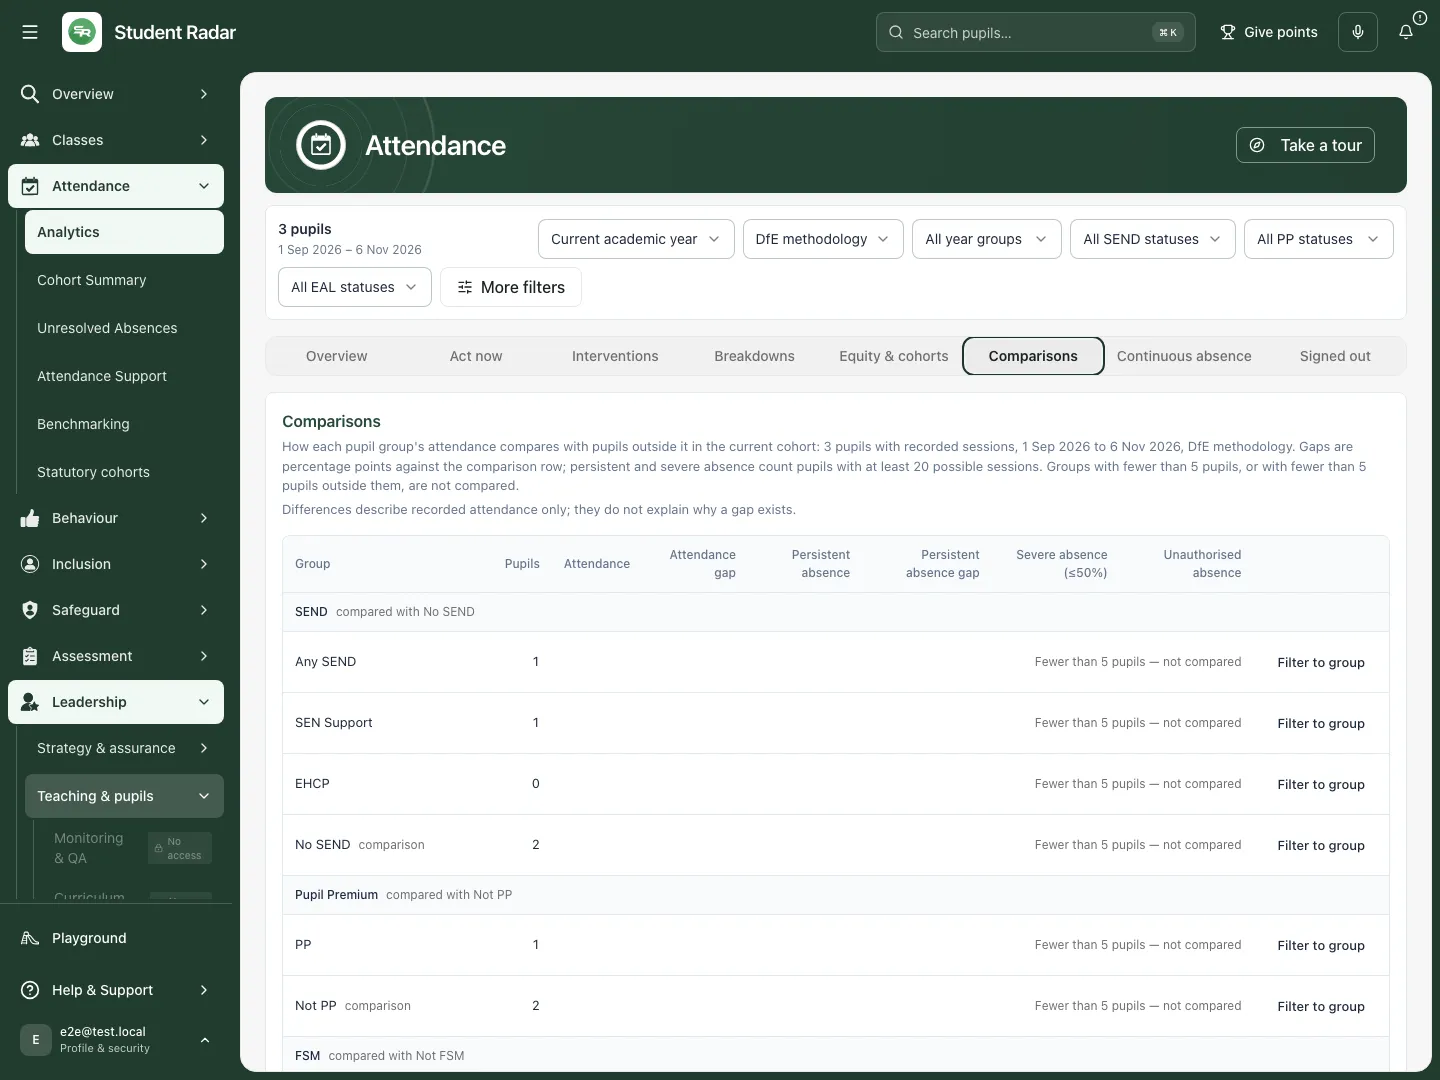
The fictional three-pupil example demonstrates the small-group message, not a publishable comparison.
Other sections and connected work
Section titled “Other sections and connected work”Overview brings together attendance, persistent absence, the target, statutory signposts, weekly patterns and benchmark reference information. Read Methodology, coverage and comparison before using a headline. The trend is session weighted. Partial weekly buckets and missing weeks must not be treated as complete observations or filled with zeroes.
Act now helps prioritise the permitted pupils for a human review. Check the underlying attendance and the date window, open the pupil where available, and agree the next action with the appropriate member of staff. A projected risk is not a finding that an intervention has failed or that a legal threshold has been met.
Interventions shows support-related attendance information. Use Open Attendance Support to work on an owned support plan. Completing support work alone is not evidence that attendance improved.
Breakdowns explores absence reasons, day and AM/PM patterns and punctuality. A missing session breakdown can leave the headline available while these charts are unavailable. Check the notice rather than interpreting an empty chart as no absence.
Equity & cohorts compares year groups and characteristics available to you. Read eligible pupil counts and any withheld or incomplete groups. Unknown characteristics should not be silently assigned to a group.
Comparisons supports a closer comparison of pupil characteristics. Keep cohort, methodology and dates aligned. If matched-pupil coverage is not verified, the page states that a same-pupil delta is unavailable; use the current period only.
Continuous absence connects permitted users to statutory monitoring. Signed out supports review of the named sign-out information available to staff. Neither section is a replacement for the school register or statutory case record.
Inspect and share a result
Section titled “Inspect and share a result”Open an available chart expansion or group list to inspect the people or values behind it. Use Export PNG or Export CSV where the expanded panel offers them. A group list can offer Export Selected. Check that the selection contains only the intended pupils, include the period/methodology in your discussion and share through your school’s approved arrangements. An export is a snapshot, not an automatically refreshed report.
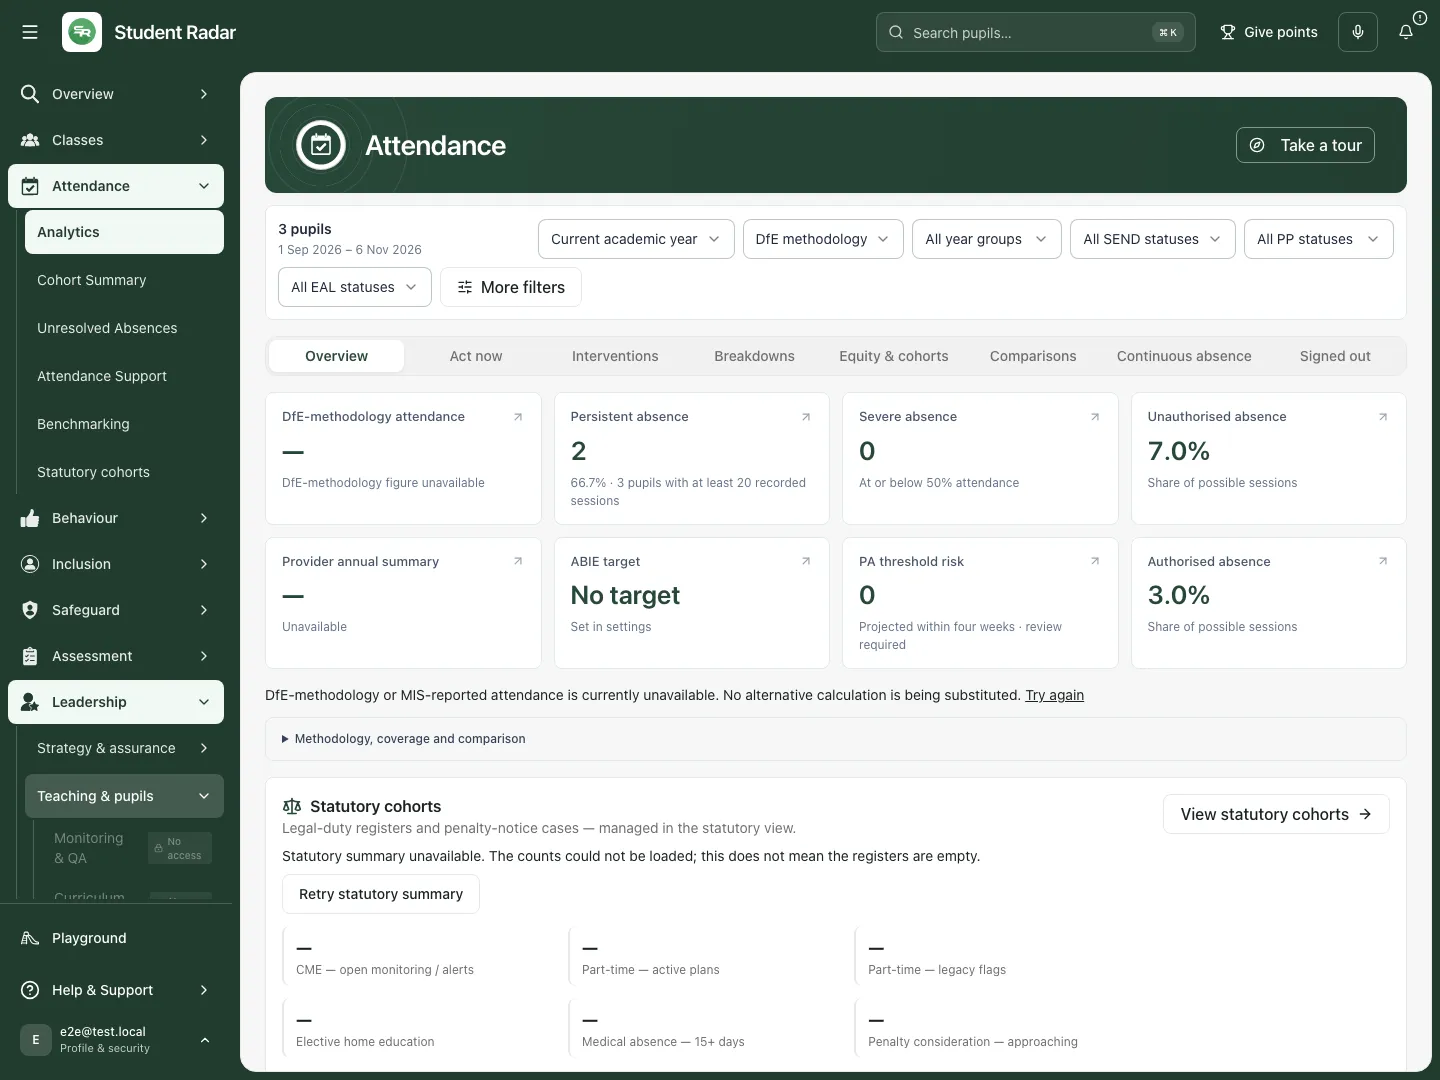
This separate failure example shows missing methodology, benchmark and statutory sources. It is not a live-school finding.
When the result is incomplete
Section titled “When the result is incomplete”- No pupils match the current filters: clear the filters and confirm the intended school and pupil scope.
- No attendance data: ask the authorised colleague responsible for the school’s attendance connection. Connecting a source is separate from reviewing a chart.
- Attendance for this selection is unavailable: use Try again. The page does not substitute another calculation. Do not quote an earlier figure as current.
- Attendance session breakdowns are unavailable: retry later; check which headline figures remain available.
- Statutory summary unavailable: this is a failed read, not an empty statutory register. Use Retry statutory summary or the permitted statutory workspace.
- No target or no published figure: confirm whether the required target/release has been recorded. Do not invent a comparator or calculate a gap from an uncertified school figure.
Use the page on a phone
Section titled “Use the page on a phone”Open the attendance-section selector to change section. Recheck the pupil count and dates after changing filters; scroll the table horizontally where needed. Open More filters for the full settings controls.
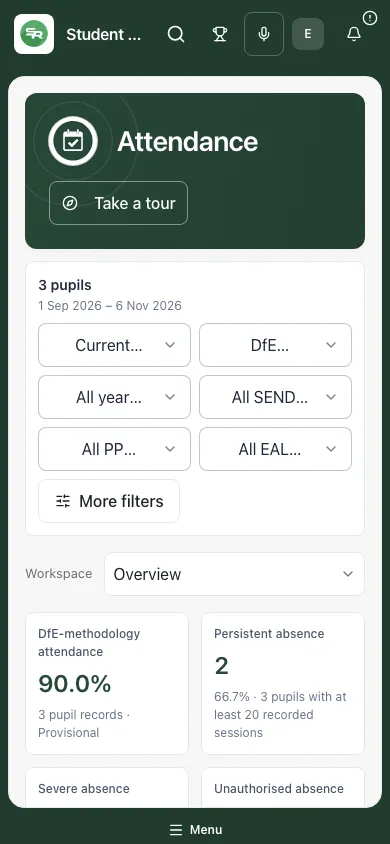
Small groups remain withheld on a phone as they are on desktop.
Questions schools ask
Section titled “Questions schools ask”Why does this differ from another report? Check methodology, dates, pupil filters, eligible sessions and coverage first. A whole-school figure and a selected-cohort figure answer different questions.
Can the system decide which sanction to use? No. Use the evidence to support an authorised human decision and record the follow-up in the appropriate support or statutory workflow.
Why is a trend or cohort missing? Source coverage, permission, eligibility and small-group rules can limit what is shown. A dash does not mean zero.
Related guides
Section titled “Related guides”Use Cohort Summary, Use Unresolved Absences, Use Attendance Support, Use Benchmarking, Use Statutory cohorts.