Compare attendance using the benchmarking context
Written for: Attendance staff, pastoral leaders and school leaders with the relevant access.
Choose the comparison measure and published year, read the method and coverage, then prepare a bounded leadership export.
Choose a meaningful comparison measure, read the dates and coverage, and use the result to frame a question for review. A similar-school comparison does not explain why attendance differs.
Before you begin
Section titled “Before you begin”Open Attendance → Benchmarking. You need the relevant benchmarking access; school-wide current figures and pupil-group breakdowns can require wider attendance access than individual pupil records. Published school context needs a matched school register/profile and an imported release for the selected year/measure. The school’s phase and the published coverage determine what comparisons are possible. Demo data is illustrative and is labelled as such.
Read the current school picture
Section titled “Read the current school picture”- Check Your school figures. Current MIS attendance uses the current school period, rather than the completed published year beside it.
- Read the attendance figure together with Historical reference · Dates and coverage. Open that disclosure and compare the current period with the published reference year.
- Check how many eligible pupils have usable counted sessions and when the data was updated. Missing session counts are excluded; incomplete coverage can make the figure less representative.
- Read any notice about unavailable placement, unmatched school, phase exclusion, small sample or historical context before interpreting a chart.
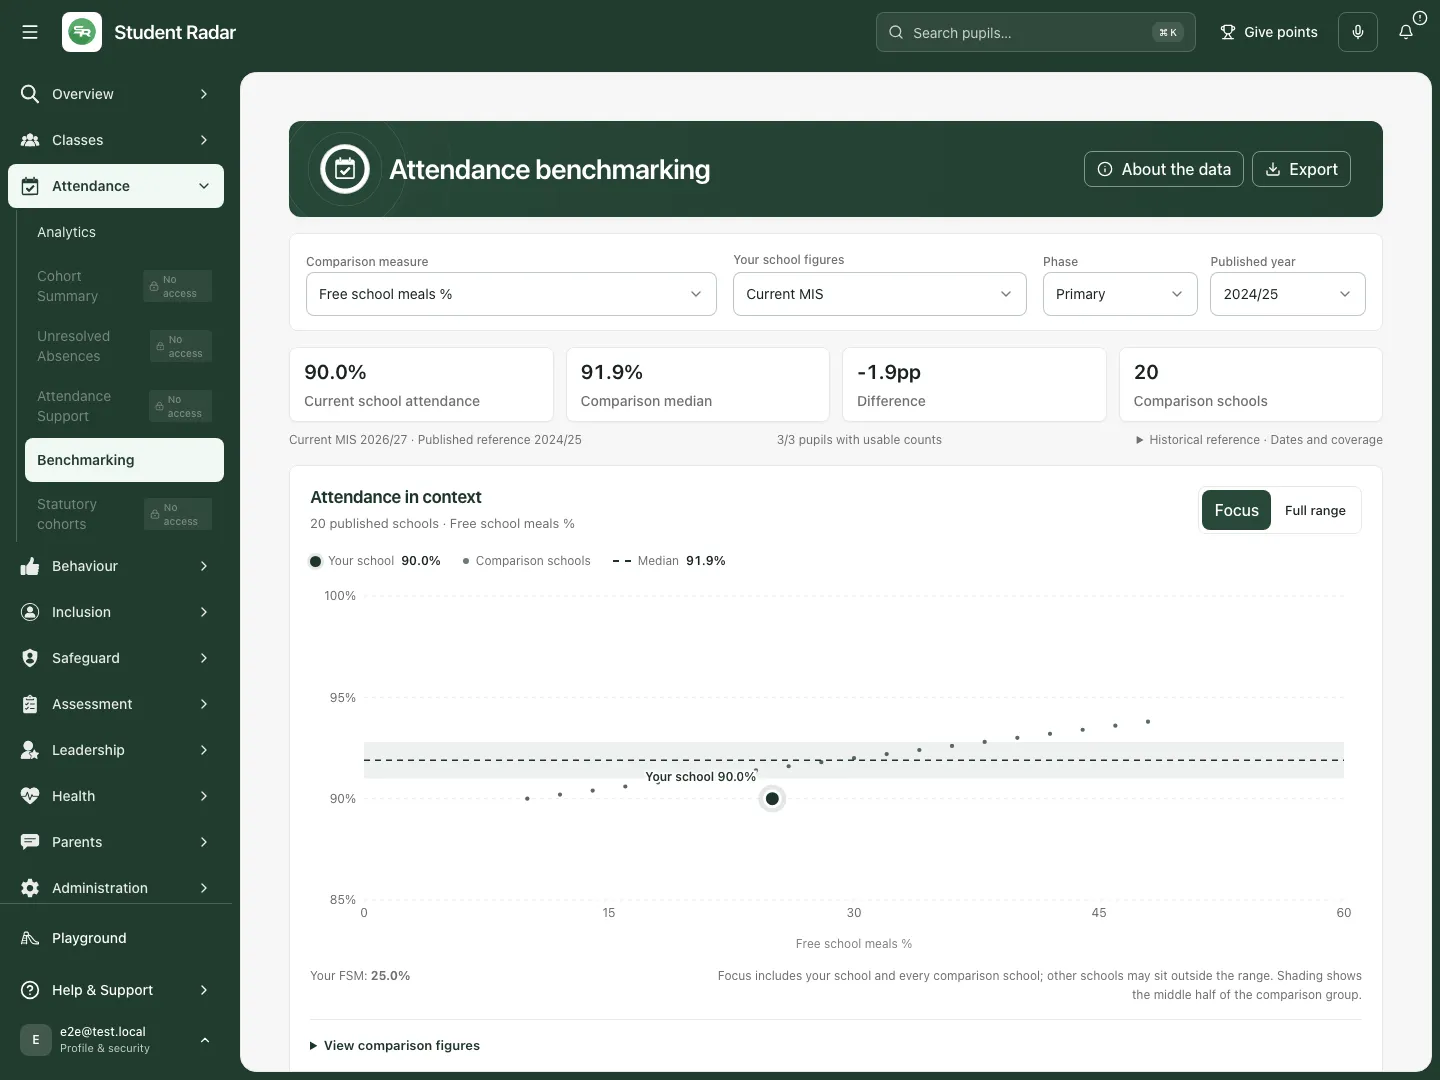
The fictional school has 270 present sessions out of 300 possible sessions; its current period is a historical-context comparison with the completed published year. Fictional school example.
Choose a fairer comparison
Section titled “Choose a fairer comparison”- Choose Phase. This limits the comparison population before similar schools are selected. Use the phase appropriate to the question, and check whether your school is included in it. All phases is available as a way back; it is not always the most useful comparison.
- Choose Published year from the available imported years. Recheck the source/release date after switching it.
- Choose Comparison measure: Free school meals %, Deprivation (IDACI), School size (pupils on roll), SEN support %, EHCP % or EAL %, where the data is available.
- A measure marked pending data cannot be selected yet. Do not substitute an unrelated measure just to obtain a chart.
- Read the selected measure and population again before discussing the plotted position. Changing the measure changes which schools count as similar; attendance itself does not select the examples.
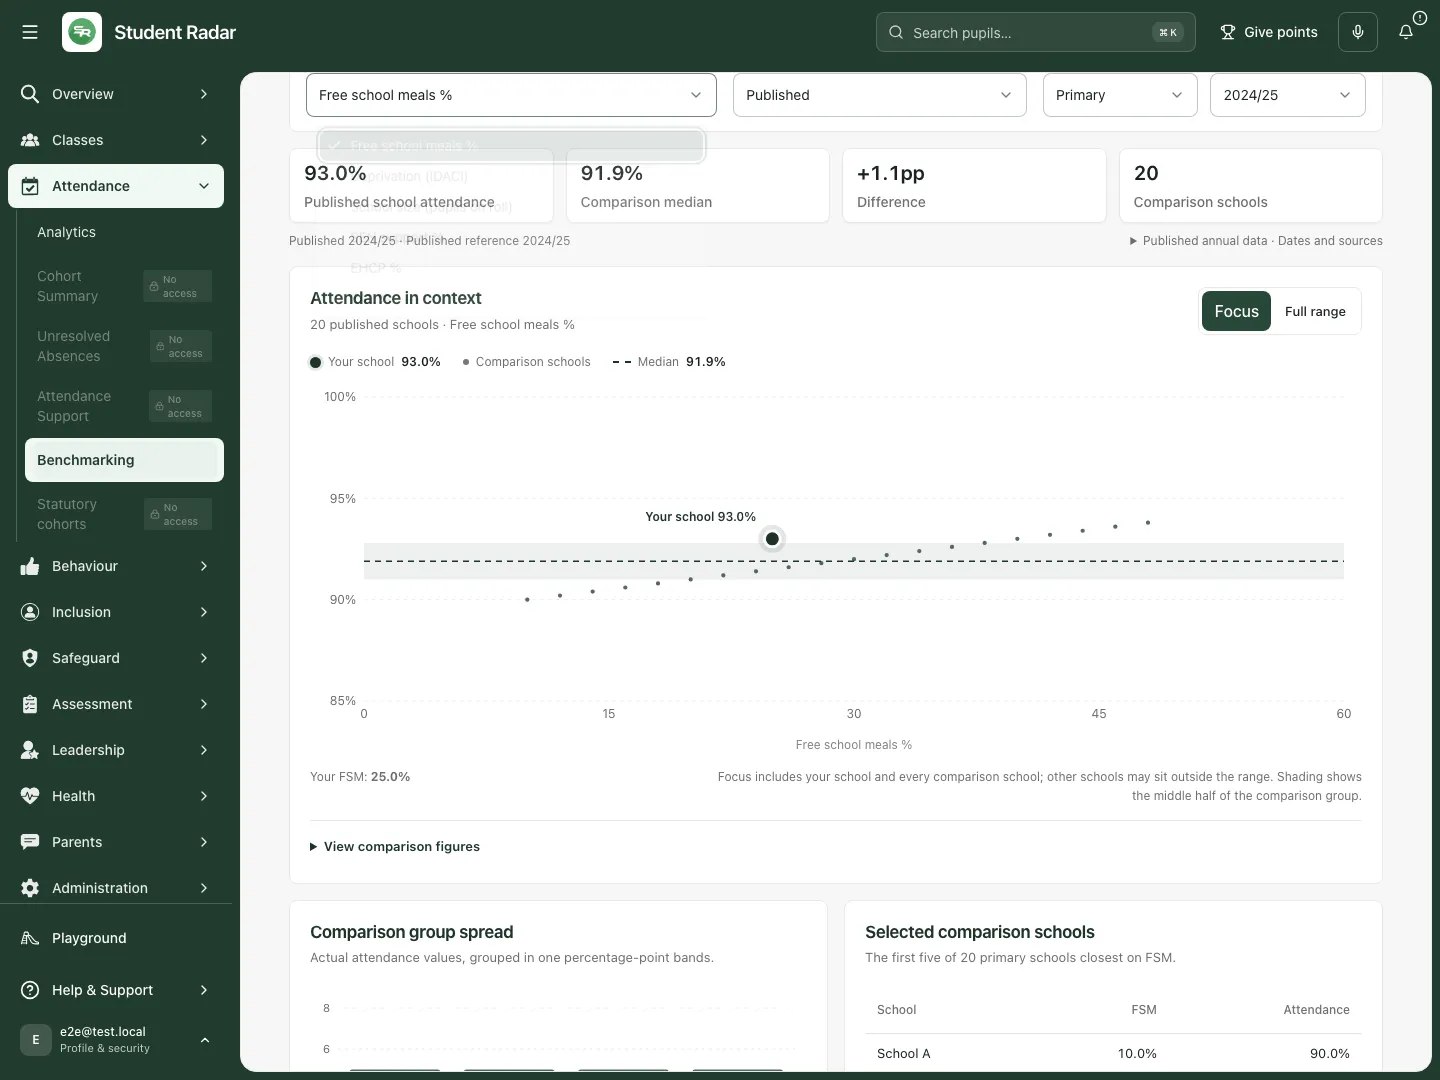
The measure selector offers different kinds of school context; availability depends on the imported data. Fictional school example.
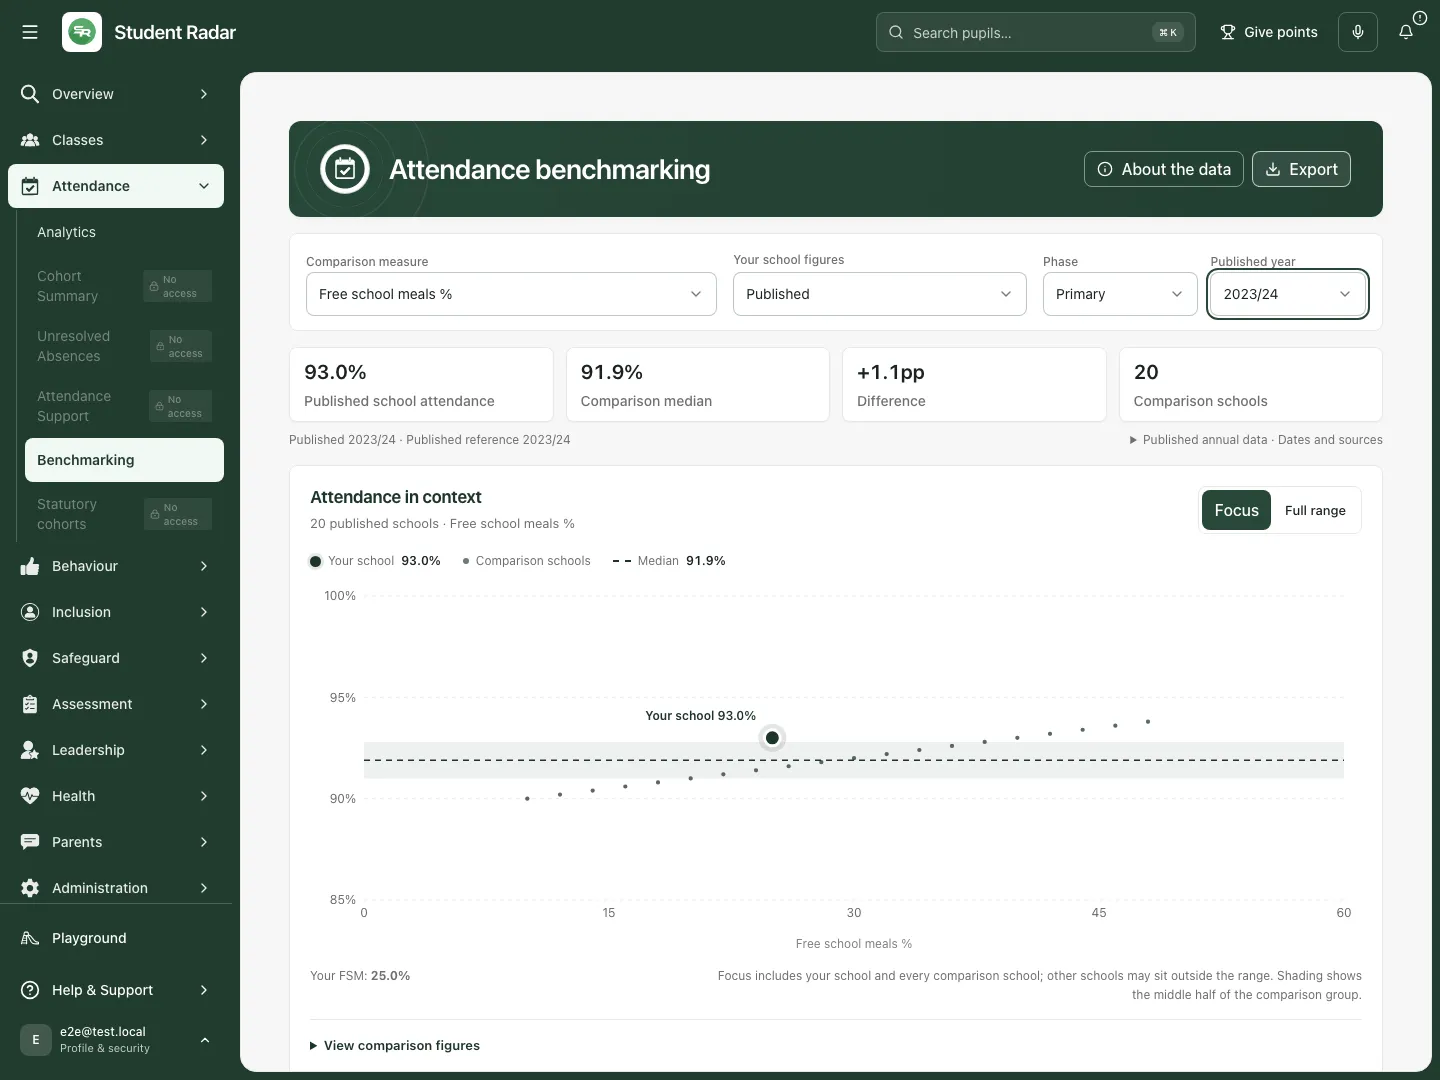
Changing the published year changes the historical reference. Keep the year visible in notes and exports. Fictional school example.
Compare the same published year
Section titled “Compare the same published year”- Open Your school figures and select Published attendance.
- Check that your school has an available published value for the selected year and is included in the chosen phase.
- Read Published annual data · Dates and sources. Your school and comparison schools now use the selected published year where available.
- Review the distribution and similar-school range with the sample size. A suppressed or unavailable school value must stay unavailable; it is not zero.
- Switch back to Current MIS attendance when returning to an operational question, and make the period difference clear again.
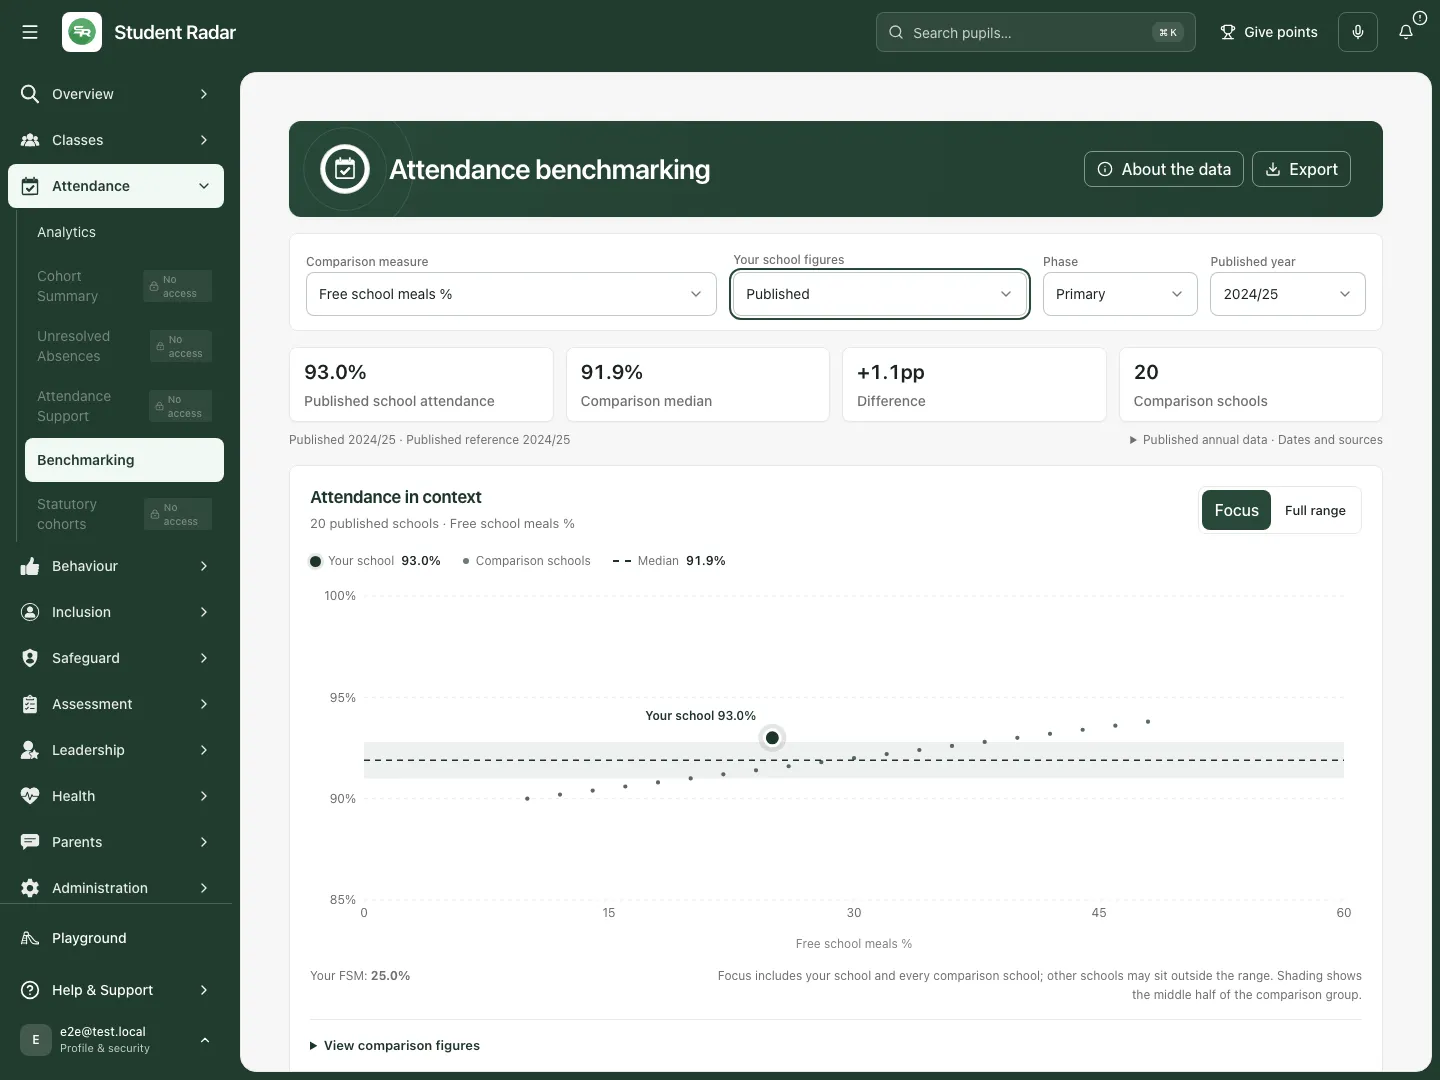
The published view uses a fictional same-year school value of 93%; it answers a different question from the current 90% working figure. Fictional school example.
Read the charts and comparison schools
Section titled “Read the charts and comparison schools”The distribution shows the selected population and the school’s position where a comparable position can be calculated. The quadrant/scatter chart relates the selected context measure to attendance; it does not prove a causal relationship. Read medians and ranges as context, not a target automatically assigned to the school.
The example-comparison-schools table selects five examples by the chosen measure with stable ties. Attendance does not influence their selection. A school can be near yours on one measure and differ in many other ways. If the sample is too small or no comparable schools are available, retain that limitation rather than constructing a ranking.
Review groups and weekday patterns
Section titled “Review groups and weekday patterns”Review the permitted group breakdown with the whole-school rate, eligible count and covered count. A withheld/suppressed group or missing rate is not an empty group. Do not reconstruct sensitive or small-group results from other totals.
Weekday attendance is a school-wide view, with its own available dates and coverage. It can be withheld when school-wide access is limited. Local benchmark context also has its own matched phase, year, sample and availability; do not treat it as interchangeable with the national published population. Use the available Attendance analytics link to investigate permitted current patterns rather than guessing why the benchmark differs.
Read the method before sharing
Section titled “Read the method before sharing”- Select About the data.
- Read How this benchmark works, especially the current-versus-published distinction, selected comparison measure, phase population and small-sample limits.
- Check the methodology against the conclusion you intend to share. A current partial-year figure and a completed published year are historical context, not a like-for-like result.
- Close the dialog and keep the chosen year, measure, school figure mode and coverage with your interpretation.
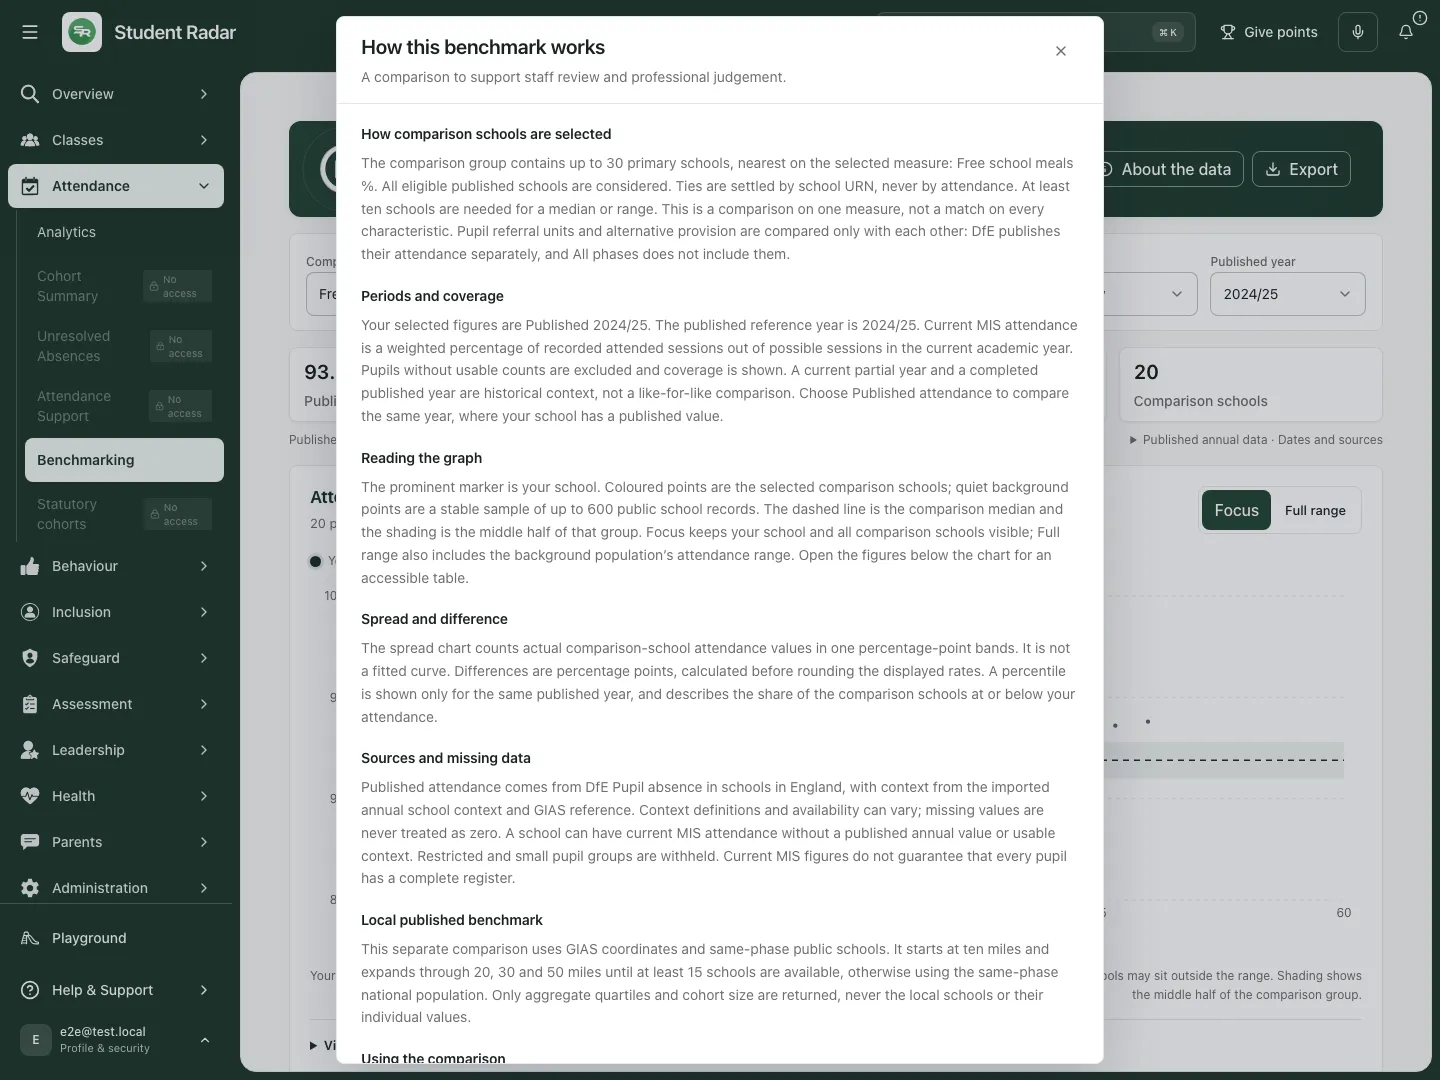
The method dialog explains why current and published periods must remain distinct. Fictional school example.
Export for a leadership or governor discussion
Section titled “Export for a leadership or governor discussion”- Choose the intended mode, phase, published year and measure first.
- Open Export, then choose Download CSV or Copy summary.
- Check the downloaded/copied content for the school, dates, source, comparison status and coverage. If copying fails, use the CSV option rather than assuming the clipboard was updated.
- Share through the school’s approved arrangements. The export is a snapshot; a later correction or imported release does not update it.
Use benchmarking on a phone
Section titled “Use benchmarking on a phone”The selectors retain the same meaning on a phone. Scroll the charts/table deliberately, open About the data, and check the chosen published year before sharing. Screen size does not make an unavailable comparison valid.
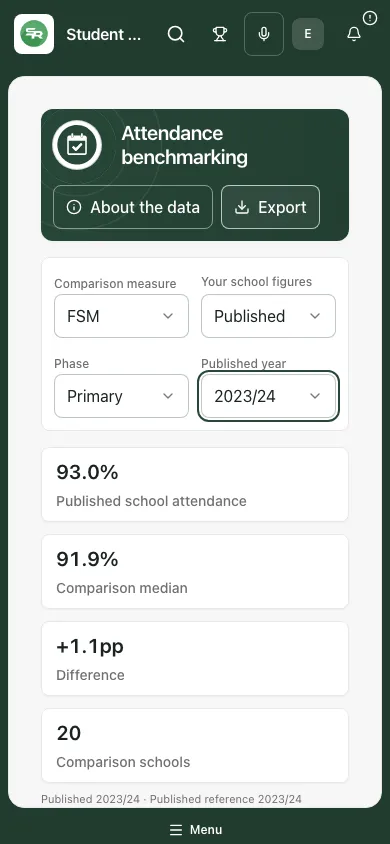
The phone view retains the selected published year and mode in the fictional example. Fictional school example.
Troubleshooting and questions
Section titled “Troubleshooting and questions”Benchmarking could not be loaded. Select Retry. A failed read is not a zero result. If access is refused, ask the administrator to check the exact benchmarking permission.
No comparable schools are available. Check the phase, year and chosen measure. The imported sample may not support the requested comparison.
My school is not placed on the chart. Read the match, phase and published-availability notice. A school needs the relevant published/context value for that placement.
Why does current MIS attendance differ from published attendance? They can cover different periods, populations and methods. Check both sets of dates and coverage before making a comparison.
Does being above the median prove our support worked? No. A relative position does not establish cause, and attendance during a period does not prove the effect of a particular intervention.
Why is a group hidden? Permission, suppression or insufficient coverage can withhold it. Do not infer membership or reconstruct the hidden rate.
Related guides
Section titled “Related guides”Use Attendance Analytics, Use Cohort Summary, Use Attendance Support.