
Guest article · Independent perspective
Inclusion: Three Fundamental and Integrated Data Frameworks
Triage. Triangulate. Transform. Repeat.

By Dr Anita Devi
Founder, TeamADL CIC · October 2026
No commercial interest to declare. This article was written specifically for Student Radar. Prior to any citation or reproduction of content, permission must be sought in writing from either Student Radar and/or Dr Anita Devi.
Access to multiple volumes of data has enhanced the pace of life phenomenally and yet on some other level it has also increased the blind spots to effective data use for the betterment of humanity. In this short article, I seek to present three data frameworks; all necessary for the effective advancement of inclusion in education. Elsewhere I have shared on many occasions, “full” inclusion is a mirage, at best. As such we need to create growth systems that embrace continuous cycles of reflection and reflexion for ongoing refinement and transformation.
1. The BiG Picture
Without a coherent schema connecting different data points, we increase the risk of overemphasising one data point over another or missing out significant pieces in the data jigsaw. Having worked in the field of Special Educational Needs, Disability and Inclusion (SENDi) for decades, I have seen and quoted many scenarios where one piece of additional information made a significant difference in determining the next steps. This can be applied to individual pupils and whole school strategic change. Therefore, as readers explore figure 1 below – the data cycle of triage, triangulation and transformation, I invite them to consider the connectivity of their own data sets in their respective educational settings.
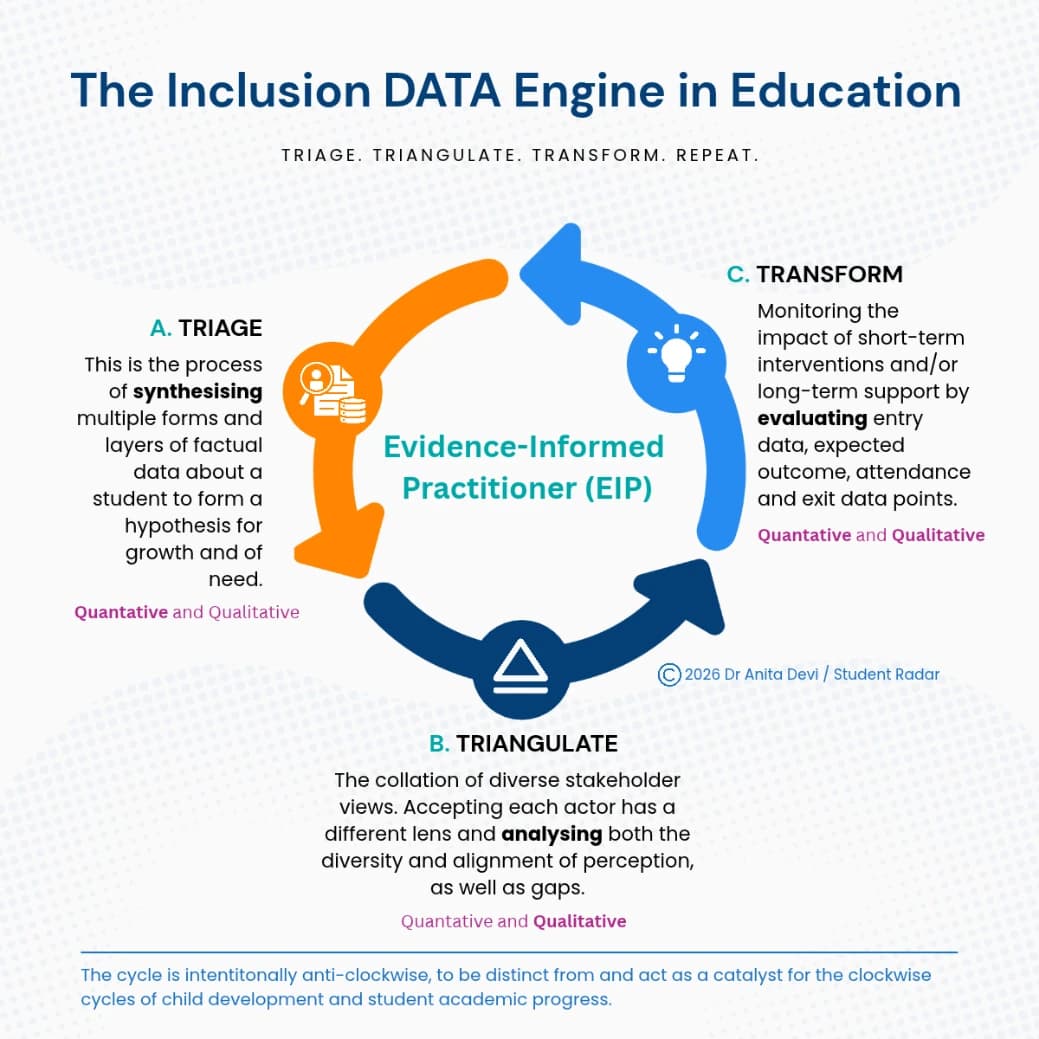
Whilst all three data points can embrace both quantitative and qualitative data, stages A and B benefit from a specific focus, whereas the transformative stage embraces both quantitative and qualitative.
TRIAGESynthesising multiple factual data inputs is important. This can include the chronology of development (e.g. did the student learn to talk before they learnt to walk?), societal information (e.g. levels of deprivation) and/or witness accounts and observations (e.g. the student only eats food if there is tomato ketchup on the plate). This data is vital for accurate understanding and discerning not only next steps, but also the differences between gaps in learning, delayed development, dual or multiple exceptionality (DME), low attainment, SEND and other forms of difference that enhance vulnerability (e.g. a lack of early nurturing or exposure to learning foundations).
TRIANGULATEIn addition to key factual information, individuals make valid observations, through their own lens of perception and experience. Gathering these and analysing them can provide vital patterns of behaviour impacted by the environment and other factors. It is important to collate as many diverse views as possible and then triangulate any emerging patterns.
TRANSFORMWhere additionality is put in place, there must initially be clarity on baseline provision and why this is not working plus additional evidence to determine whether a short-term intervention is required or the need warrants much longer-term support.
An ‘evidence-based’ approach is the ‘drop in phrase’ for the teaching profession at the moment. It is not new, but certainly back in vogue.
Evidence-based practice (EBP) is the idea that professional decisions and behaviours are based on scientific evidence. It can involve a probability / likelihood component, and the outcome is often defined by national standards. In some instances, individual capability is enhanced. However, EBP doesn’t always lead to capacity-building, and the evidence is likely to be conflicting. EBP mirrors a medical approach.
Evidence-informed practice (EIP) supports knowledgeable / ethical professional decision-making and practice. Decisions are informed not only by the best available research evidence, but also by the wishes and views of children, young people and families plus ethical principles and the local context. EIP views the relationship between general knowledge and specific practice challenges as more complex than the commonly used phrase ‘using’ evidence or knowledge in practice. This is a relational model.
Finally note the comment on an anticlockwise motion for this cycle. This is about a distinctive approach and creating cycles of transformation that act as a catalyst for growth. Presenting the cycle in a clockwise direction can result in the pupil trajectory being absorbed by a focus on academic progress and natural stages of child development. Both of these are important and contributory. However, in the context of inclusion, this article considers the vulnerability of learners, who for a variety of reasons may be considered outliers. To measure impact, this process needs to be distinct yet aligned.
2. The Transformation Leadership Process
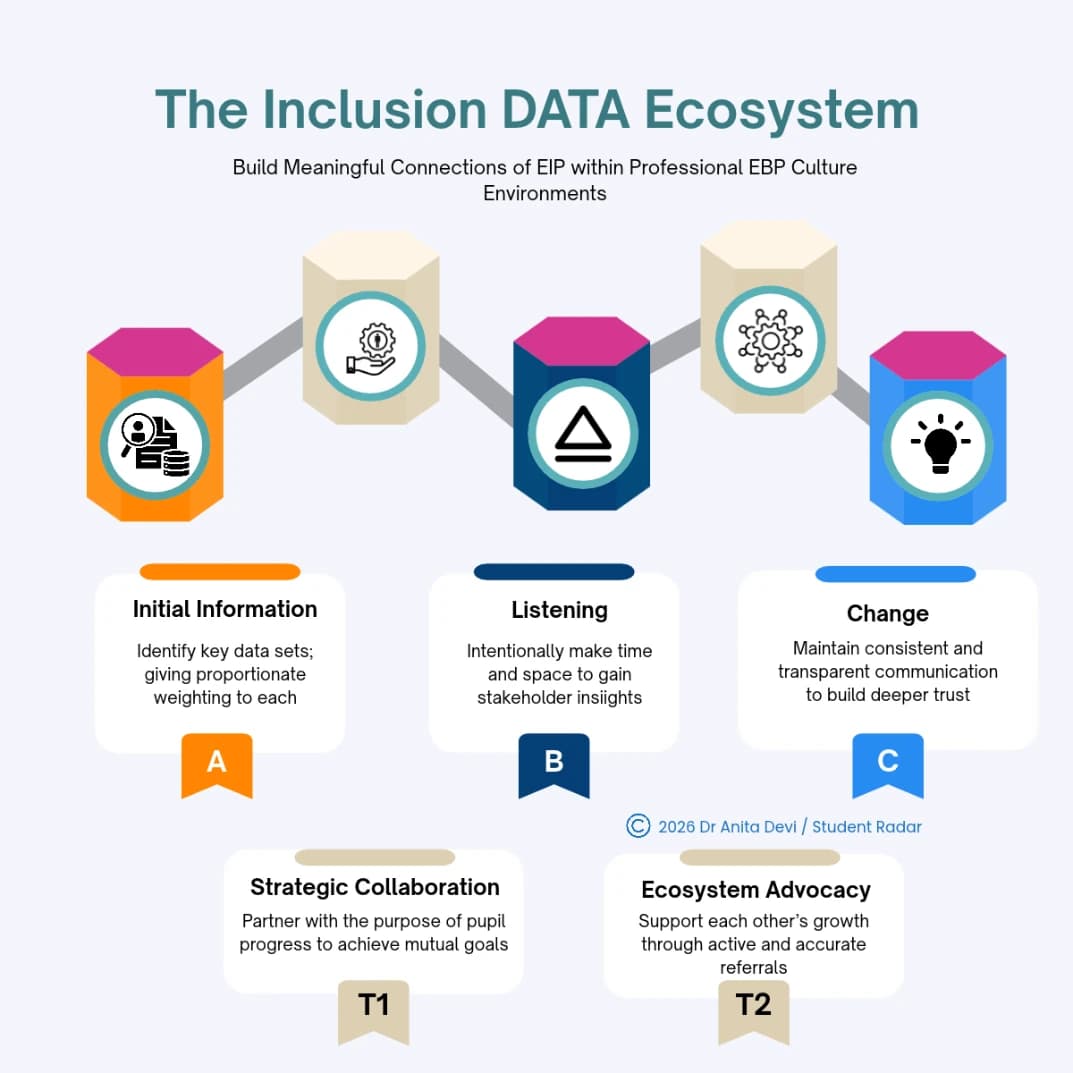
Like water, if data is stagnant, it can increase risk and cause detrimental damage through toxins. Whilst figure 1 highlights a cyclical movement, the flow of data warrants a distinctive comment. Effective data use for pupil efficacy needs to be intentional.
Points of interest
- Evidence-informed practice/practitioners (EIP) exist within environments of Evidence-based practice culture (EBP). Again, this distinction is important, as one does not necessarily imply the other. It is possible for senior leaders to create an evidence-based environment, and individual practitioners to not approach teaching and learning from an evidence-informed stance. Continuous Professional Development (CPD) should serve to enhance individual EIP, within an EBP environment.
- Data transition points between A and B plus B and C require different leadership skill sets, such as managing difficult conversations, authenticity of action and serenity of wisdom.
- Figure 1 demands a loop completion between stage C and stage A (repeat loop). Graphically this has not been included in figure 2. Transformational change should lead to ‘Initial Information’ becoming ‘Enhanced Information’. This operates at many levels including (but not restricted to) – high aspirations* and avoiding stigmatisation (e.g. S/he is always like that!).
Aspiration* is “The ability (an opportunity) to set goals for the future whilst maintaining the motivation, inspiration, independence and confidence in the present to reach those goals utilising a thought-out plan of action for learning.” (Devi, 2016)
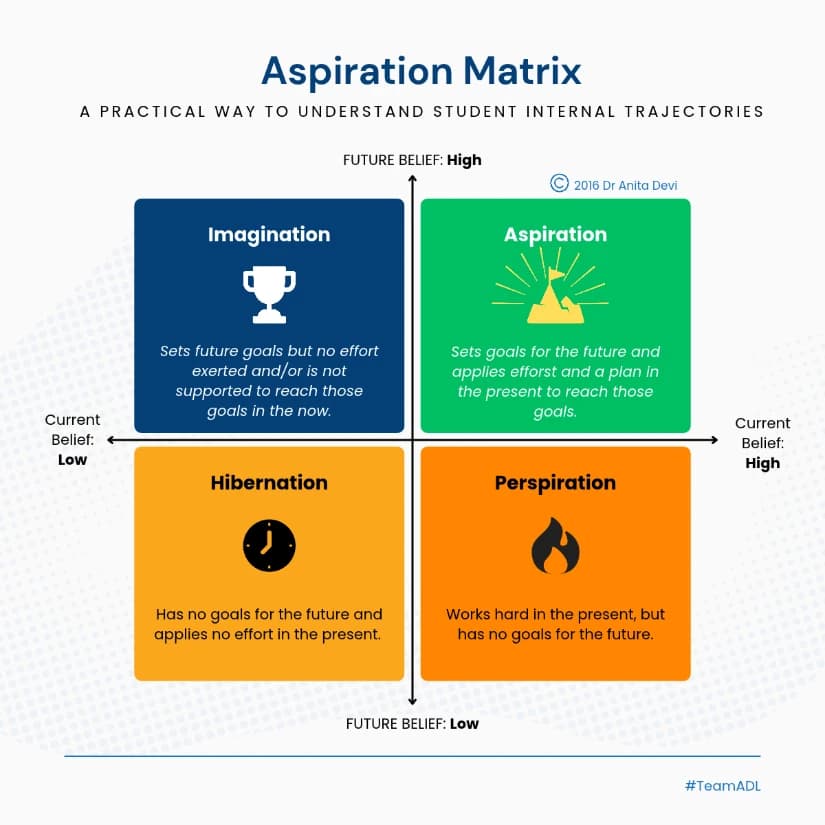
The visual Aspiration Matrix is something I developed in 2016 to support leaders and practitioners understand their role in promoting high aspirations, by understanding where students are currently at. Over the years, I have reviewed many settings and even those with outstanding pupil assessment results and excellent inspection grades have discovered many of their learners are in perspiration mode. They may achieve in the school system, but they have no real sense of long-term direction. Ten years on, the recent Milburn Review (2026) on ‘Young People and Work’ affirms this perspective.
3. The Sweet Spot
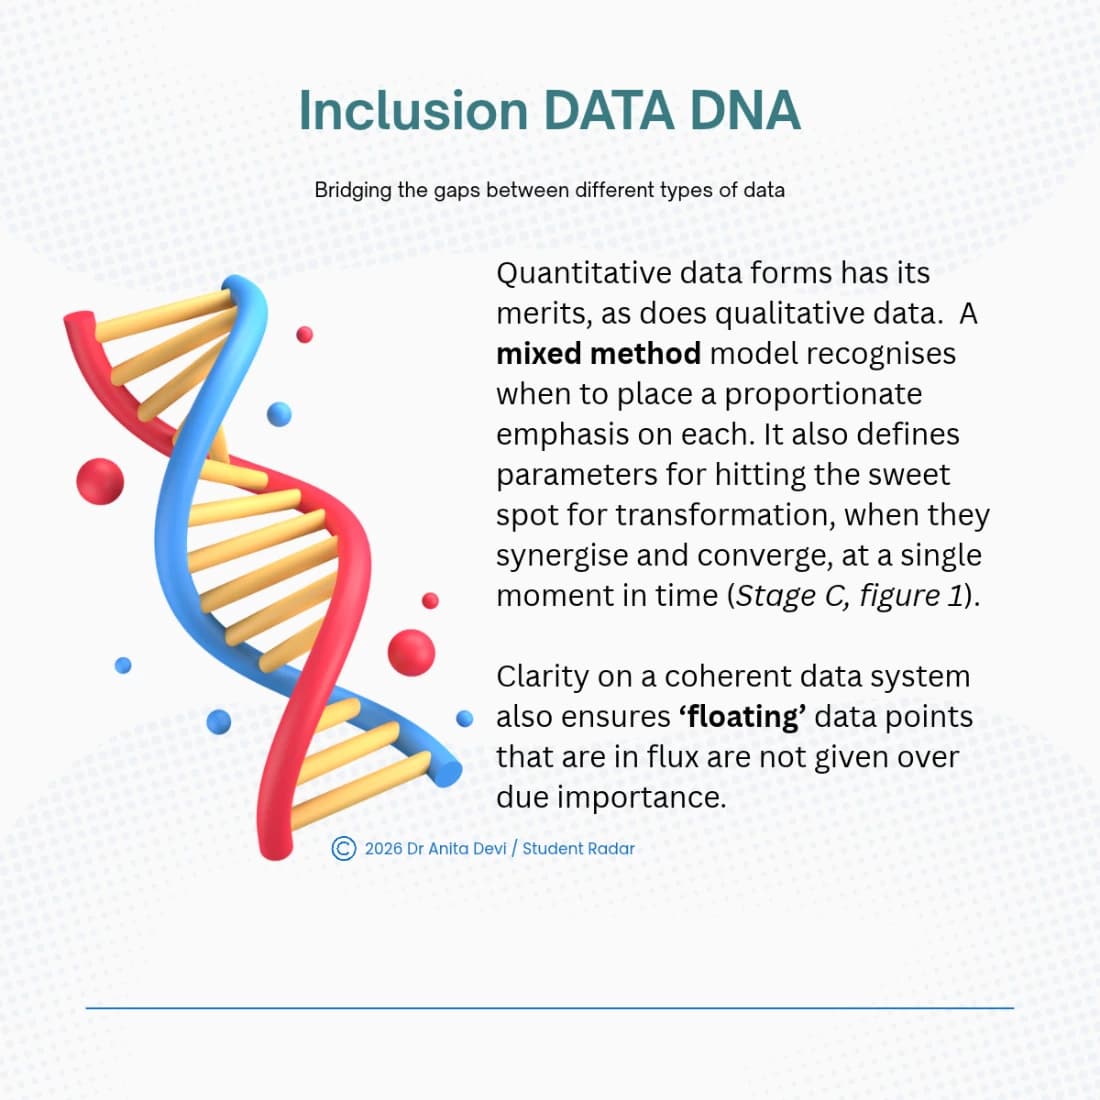
Finally, let us address the relational value between quantitative and qualitative data sets (figure 3).
You will have noticed in sharing these three data frameworks with you, I intentionally started with the big picture drilling down to Inclusion Data DNA. Having vision for the big picture and specific details simultaneously is vital for the Leadership of Inclusion. Too often leaders focus either on just the big picture or the specifics. This is why building diverse teams is critical to inclusive practice. Over the years, I have seen many (with the responsibility of leading inclusion) start with specifics and then try and build up but sadly lose momentum on the way. Building up this way is hard. Drilling down is not only far easier, but it reflects an important human value of inclusion; namely humility. As C.S. Lewis points out, “Humility is not thinking less of yourself, it’s thinking of yourself less.” Once the big picture and specifics are established, zooming in or out becomes second nature to the organisation and stakeholders. But until then, facilitating inclusive cognisance is critical.
Concluding remarks
We are currently at a significant historical juncture in education, where we can either allow AI to lead us down various undefined cul-de-sacs or we can be intentional in our data use by directing the flow and different points in the cycle. This is a decision education leaders will need to make for individual settings and at local, regional and national level. In the meantime, in England those involved in drafting an Inclusion Strategy under the White Paper Reforms introduced in 2026, are encouraged to consider the points raised in this article, in relation to their determined direction of travel.
- How well is data collated, analysed and used for transformative learning?
- Is there consistency, coherence and connectivity?
- What needs to change and why?
No commercial interest to declare. This article was written specifically for Student Radar. Prior to any citation or reproduction of content, permission must be sought in writing from either Student Radar and/or Dr Anita Devi.
© 2026 Dr Anita Devi. All rights reserved. To request permission to cite or reproduce this article, contact Anita via LinkedIn or Student Radar at info@studentradar.com.
Keep a copy
The PDF has the full article, all four figures and the permission notice.
Download the article(PDF, 6 pages, 1.5 MB)